The Airports Council International (ACI) has recently revealed its list of the Top 10 busiest airports in the world for 2022.
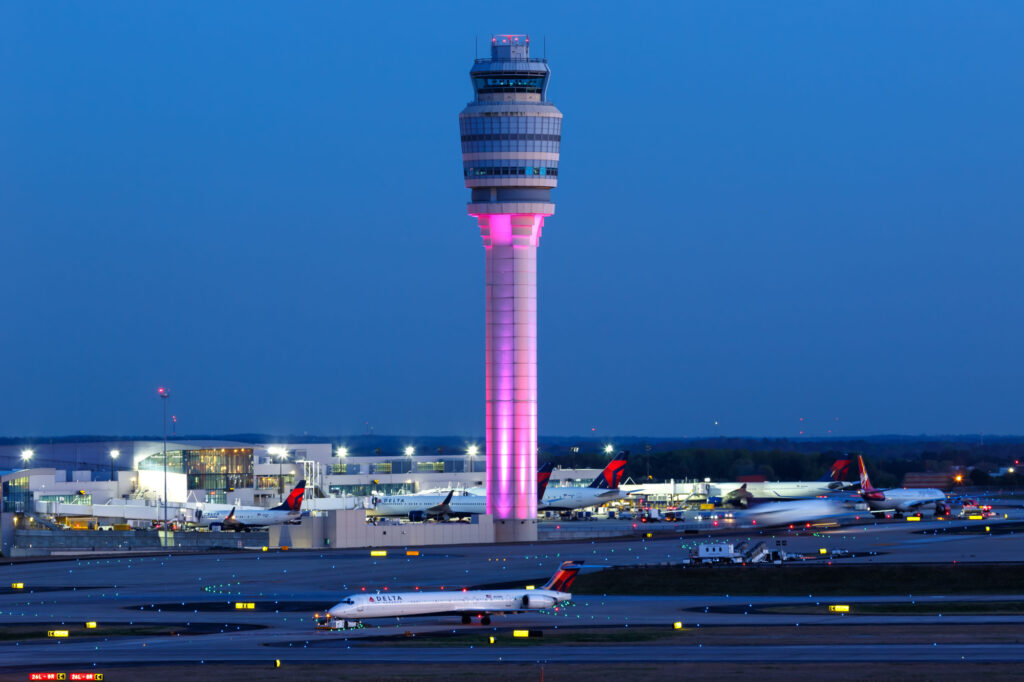
According to preliminary figures, Hartsfield-Jackson Atlanta International Airport (ATL) has retained its position as the world’s busiest airport overall, while Dubai International (DXB) has been ranked the busiest international hub.
Here, we take a close look at airports’ passenger traffic, cargo and aircraft movements.
Total passenger traffic for 2022
Initial data from the ACI suggests that global passenger traffic during 2022 reached almost seven billion passengers. This represents an increase of 53.5% on 2021 figures and is 73.8% of the total number of passengers handled back in 2019.
The top 10 airports accounted for 10% of global traffic, with an 85.9% recovery compared to pre-pandemic levels in 2019.
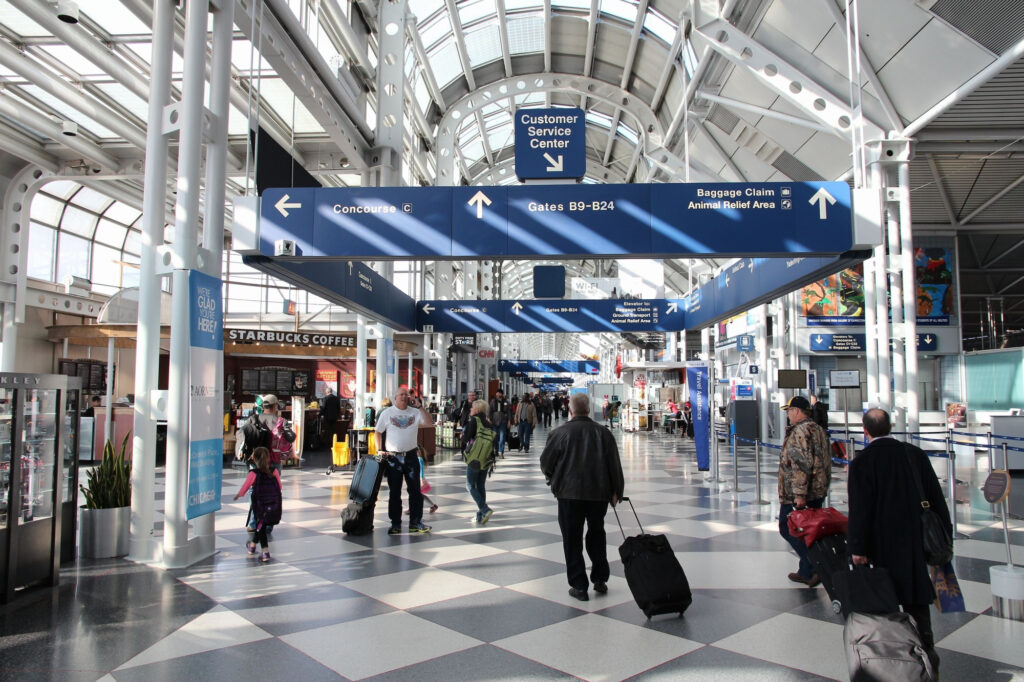
The top four airports in 2022 remained the same as in 2021, with Hartsfield-Jackson Atlanta (ATL) being the busiest airport, welcoming 93.7 million passengers, followed by Dallas/Fort Worth (DFW) with 73.4 million, Denver (DEN) with 69.3 million, and Chicago O’Hare (ORD) with 68.3 million. Dubai International (DXB) ranked fifth in 2022, climbing from sixth position in 2021, which was previously held by Los Angeles (LAX).

The rest of the top 10 consisted of airports that regained their status as the world’s busiest gateways, such as Dubai (DXB), London Heathrow (LHR), and Paris CDG (CDG), or continued to experience rapid growth in passenger traffic, such as Istanbul (IST) and Delhi (DEL). Five of the top 10 airports are within the United States, and they have a significant proportion of domestic passengers, ranging from 75% to 95%.
London Heathrow (LHR) experienced the most substantial boost in the top 10 rankings, climbing from 54th place in 2021 to the eighth spot in 2022 after the reopening of borders that had been closed for two years.
| 2022 | 2021 | Airport | 2022 | % change vs 2021 |
| 1 | 1 | Atlanta GA, US (ATL) | 93 699 630 | 23.8 |
| 2 | 2 | Dallas/Fort Worth TX, US (DFW) | 73 362 946 | 17.5 |
| 3 | 3 | Denver CO, US (DEN) | 69 286 461 | 17.8 |
| 4 | 4 | Chicago IL, US (ORD) | 68 340 619 | 26.5 |
| 5 | 27 | Dubai, AE (DXB) | 66 069 981 | 127.0 |
| 6 | 5 | Los Angeles CA, US (LAX) | 65 924 298 | 37.3 |
| 7 | 14 | Istanbul, TR (IST) | 64 289 107 | 73.8 |
| 8 | 54 | London, GB (LHR) | 61 614 508 | 217.7 |
| 9 | 13 | New Delhi, IN (DEL) | 59 490 074 | 60.2 |
| 10 | 31 | Paris, FR (CDG) | 57 474 033 | 119.4 |
Total international passenger traffic
Dubai International (DXB) remained the busiest international airport in the world, receiving 66.06 million travelers, which represents a 127% growth when compared to 2021 levels. However, that is still 23.5% below the pre-pandemic traffic statistics.
London Heathrow (LHR) made a remarkable comeback to the top 10 international airports. Istanbul (IST), which was the second-busiest international airport last time, dropped to the fifth position. Amsterdam Schiphol (AMS) retained its third place ranking globally, and Paris (CDG) held the fourth position.
| 2022 | 2021 | Airport | 2022 | % change vs 2021 |
| 1 | 1 | Dubai, AE (DXB) | 66 069 981 | 127.0 |
| 2 | 7 | London, GB (LHR) | 58 243 060 | 230.5 |
| 3 | 3 | Amsterdam, NL (AMS) | 52 467 346 | 105.8 |
| 4 | 5 | Paris, FR (CDG) | 51 763 569 | 128.9 |
| 5 | 2 | Istanbul, TR (IST) | 48 521 725 | 83.3 |
| 6 | 4 | Frankfurt, DE (FRA) | 44 771 711 | 97.3 |
| 7 | 9 | Madrid, ES (MAD) | 36 231 191 | 136.2 |
| 8 | 6 | Doha, QA (DOH) | 35 726 721 | 101.8 |
| 9 | 95 | Singapore, SG (SIN) | 31 902 000 | 952.9 |
| 10 | 95 | London, GB (LGW) | 30 145 083 | 501.5 |
Luis Felipe de Oliveira, the director general of ACI World, said: “The new top 10 busiest airports for passenger traffic reflects the resilience of the airport and aviation industry, and the eagerness of passengers to travel by air”.
“While US airport hubs were able to recover quicker due to their strong domestic market, we are now witnessing global hubs joining upper ranks – including Dubai, Istanbul, and London Heathrow.
“The re-opening of China, the second largest aviation market after the US, is now expected to bring an overall gain, both domestically and for international travel.”

Total cargo traffic
Air cargo volumes experienced a reduction of 6.7% year over year (YOY) in 2022, totaling around 117 million metric tons.
In 2022, the top 10 airports for air cargo traffic accounted for approximately 27% of the total global air cargo traffic, which amounted to 30.8 million tons. However, the airports experienced a 9.9% decline in 2022 compared to the previous year 2021. Despite this decline, they still showed an overall improvement of 4.1% in air cargo traffic compared to 2019.
The drop in cargo volumes has been attributed to persistent geopolitical tensions and disruptions to supply chains and global trade.
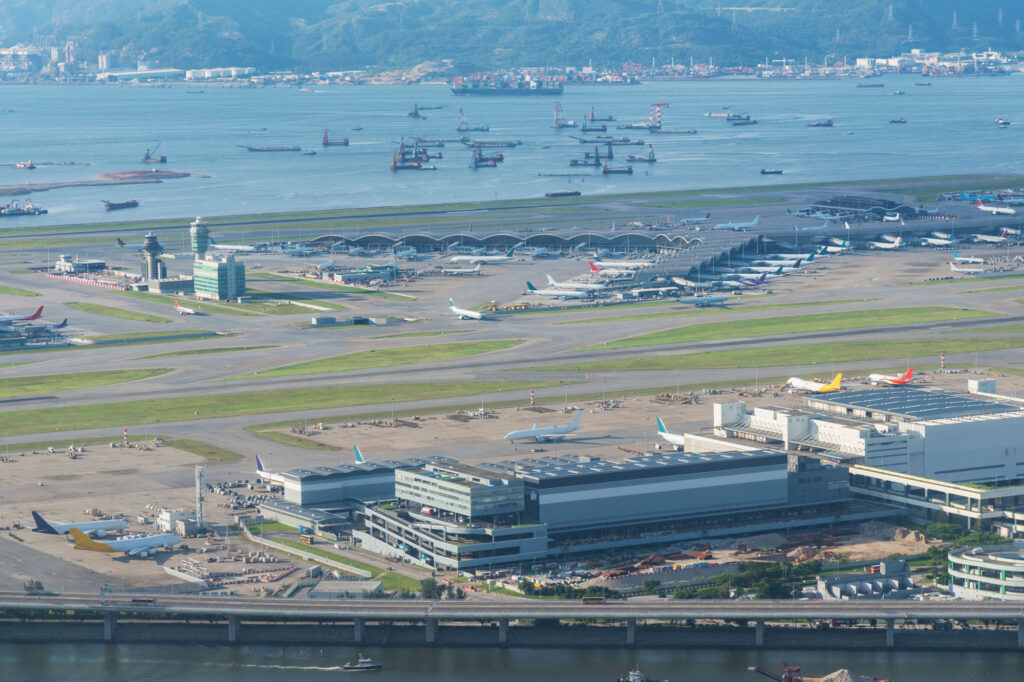
Hong Kong (HKG) maintained its position as the top-ranked airport for air cargo traffic with 4.2 million tons, followed by Memphis (MEM) with 4.0 million and Anchorage (ANC) with 3.5 million. Shanghai Pudong (PVG) fell from the first to the fourth position, handling 3.1 million tons of cargo in 2022.

| 2022 | 2021 | Airport | 2022 | % change vs 2021 |
| 1 | 1 | Hong Kong SAR, HK (HKG) | 4 199 196 | -16.4 |
| 2 | 2 | Memphis TN, US (MEM) | 4 042 679 | -9.8 |
| 3 | 4 | Anchorage AK, US (ANC) | 3 461 603 | -4.3 |
| 4 | 3 | Shanghai, CN (PVG) | 3 117 216 | -21.7 |
| 5 | 6 | Louisville KY, US (SDF) | 3 067 234 | 0.5 |
| 6 | 5 | Incheon, KR (ICN) | 2 945 855 | -11.5 |
| 7 | 7 | Taipei, TW (TPE) | 2 538 768 | -9.7 |
| 8 | 12 | Miami FL, US (MIA) | 2 499 837 | -0.8 |
| 9 | 8 | Los Angeles CA, US (LAX) | 2 489 854 | -7.6 |
| 10 | 9 | Tokyo, JP (NRT) | 2 399 298 | -9.3 |
Aircraft movements
Airports worldwide experienced a significant increase in aircraft movements (takeoffs and landings of airplanes at an airport) in 2022, with approximately 89 million movements, a growth of 20.4% from the previous year. This recovery indicates an 82.5% return to the pre-pandemic levels in 2019.
The top 10 airports for aircraft movements, which accounted for nearly 7% of global traffic, recorded a growth of 11.4% from 2021 figures, achieving a recovery of 91.5% compared to their 2019 statistics.
Atlanta Airport (ATL) maintained its position at the top of the rankings with 724,000 aircraft movements, representing a 2.3% increase from the previous year, but a decrease on the 2019 results when it came second only to Chicago O’Hare.

| 2022 | 2021 | Airport | 2022 | % change vs 2021 |
| 1 | 1 | Atlanta GA, US (ATL) | 724 145 | 2.3 |
| 2 | 2 | Chicago IL, US (ORD) | 711 561 | 4 |
| 3 | 3 | Dallas/Fort Worth TX, US (DFW) | 656 676 | 0.7 |
| 4 | 4 | Denver CO, US (DEN) | 607 786 | 4.6 |
| 5 | 7 | Las Vegas NV, US (LAS) | 581 116 | 19.4 |
| 6 | 6 | Los Angeles CA, US (LAX) | 556 913 | 9.9 |
| 7 | 5 | Charlotte NC, US (CLT) | 505 589 | -2.8 |
| 8 | 9 | Miami FL, US (MIA) | 458 478 | 18.2 |
| 9 | 27 | New York NY, US (JFK) | 448 847 | 54.4 |
| 10 | 33 | Istanbul, TR (IST) | 425 890 | 52 |
Data from: https://airport-world.com/traffic-data-reveals-the-busiest-airports-in-the-world-in-2022/


